This article provides a better understanding of how to use Red Gate's ANTs Performance Profiler to troubleshoot performance issues.
For demonstration purposes, an Ektron OnTrek site is profiled in the Visual Studio Web Development Server. To set up ANTS Performance Profiler:
- In the ANTS Performance Profiler start screen, select New profiling session then open the Web dev. Server - ASP.NET tab.
- In ASP.NET web application (path), browse to the site's root folder.
- Choose the required profiling mode. Here, use line-level and method-level timings for methods with source only.
- Click Start profiling to begin.

- The default browser (chosen on the setup page) loads the selected site.

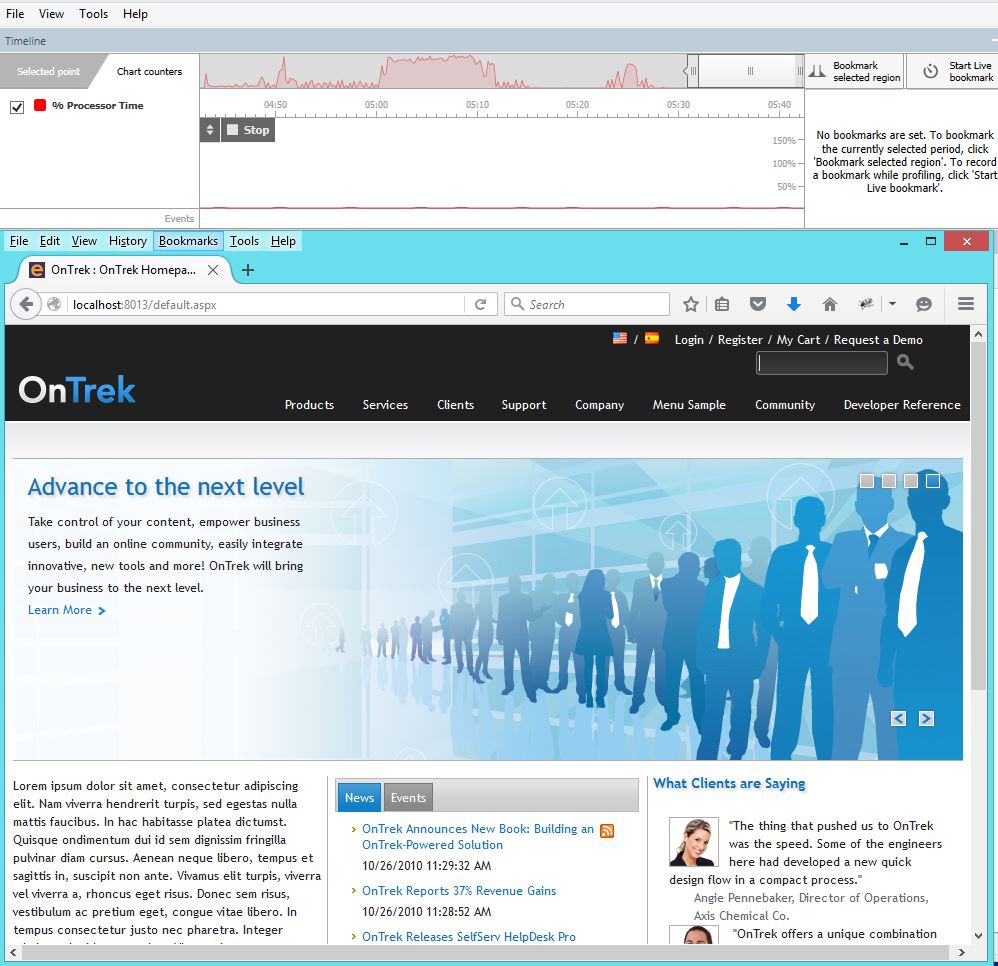
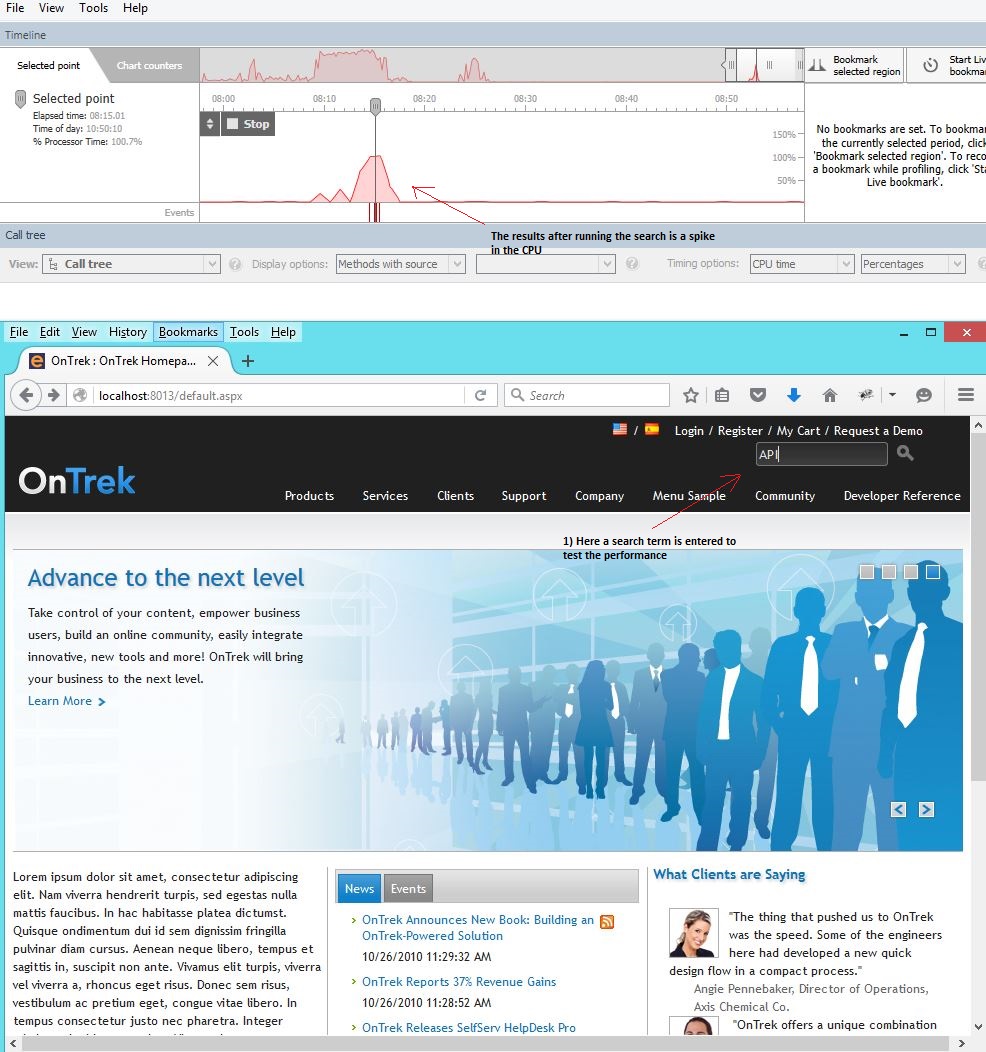
While using the OnTrek site, ANTS Performance Profiler's timeline shows the CPU usage the application has caused.

You can expect a CPU peak when the site launches. The CPU then returns to near zero until a search term is entered. After the term is entered, the CPU begins to grow, staying high for about 8 seconds. If there is a performance issue, the CPU may spike to nearly 100%, which clearly indicates a performance bottleneck in the search feature.
Analyzing the profiler's results
- Click and drag on the profiler's timeline to select the region of time where CPU usage was high. After a few moments, full results are shown.

- At the top of the call tree, ANTS Performance Profiler shows the "hottest" stack trace, that is, the code that results in the greatest proportion of CPU time. Ideally, this is a good place to start fine tuning or optimizing the code.
For more information on hot stacks and HTTP nodes, see ANTs Profiler's documentation on Working with the call tree.
Using the Profiler to analyze code
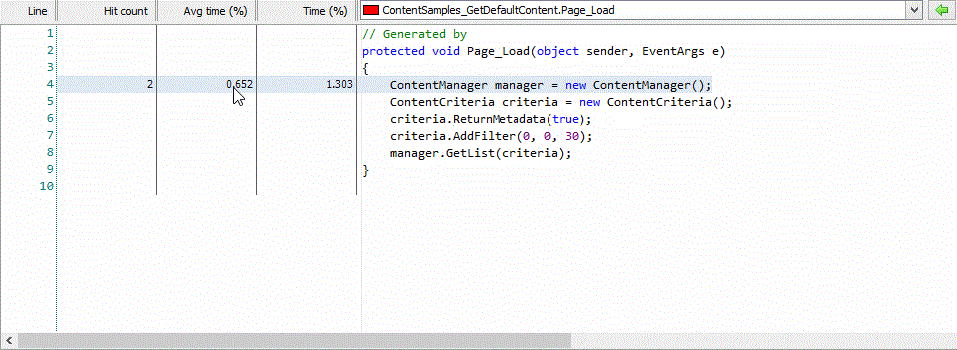
For testing purposes, a code sample was created using the content manager get list to show how to analyze API calls.
- Here, the Profiler loaded the test template and monitored the steps until the page completely loaded.

- From this screen, you can step into the template to find the method qualifying as the most expensive stack trace and make adjustments.

- Here, you can navigate to the template/code method in question. Additional data on CPU usage, duration and hit counts are recorded for a more accurate reading.
For more on source code view, see ANTs Profiler's documentation on Working with source code.
Related Articles
- The Performance Impact of Returning Metadata
- ContentManager.GetList with Fallback Language Performance Issue
- Troubleshooting Performance Issues
- Performance - Worker Process Current Requests
- TaxonomyManager and ContentManager Related API and Database Performance Tips
- Purge eCommerce Basket Addresses Login Performance Issue
Please sign in to leave a comment.