Below is a tool for diagnosing a lack of or extra Java processes on the Solr server. Whenever diagnosing a Solr-based issue, it is recommended to check the number of Java processes.
Process Explorer is a helpful tool for diagnosing what is happening with the Java.exe processes of Solr. Below is a download link for the tool:
https://technet.microsoft.com/en-us/sysinternals/processexplorer.aspx
- Run the Process Explorer app on the Solr server.
- Scroll down until you see Java.exe.
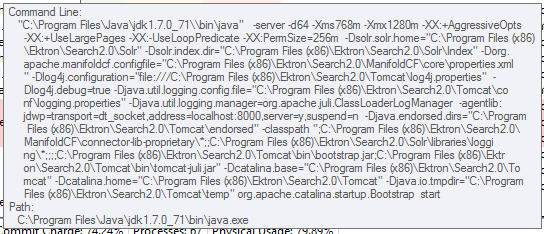
- Hover over the java.exe. You see a block of text like below. This is normal.


By default, 9.1 Solr has three java processes; 9.2 Solr has four. If you see extra java processes, that typically means that the Java.exe processes did not shut down fully prior to a start-up attempt. Follow these steps to rectify that issue.
- View the processes in Process Explorer.
- Look for a process called (viewed at the end of the Command Line and just before the Path): Manifoldcf.agents.AgentStop and manifoldcf.agents.initializeandrestart.
- End the Manifoldcf.agents.AgentStop process and then the manifoldcf.agents.initializeandrestart process.
- The correct manifoldcf.agents.AgentRun process appears.
This can be helpful in ending infinite Solr crawls, if the Solr Process Manager Service has been restarted several times.
Please sign in to leave a comment.