If sync is running longer than expected or it is not syncing the expected items it can sometimes be helpful to create a SQL Profiler trace to show what queries are executing.
SQL Profiler Trace Setup Steps
- Open SQL profiler (tools > SQL Profiler from SQL Management Studio).
- Click File then New Trace.
- Enter the SQL Server of the receiving database(if necessary you can also setup on the sending side) and click connect.
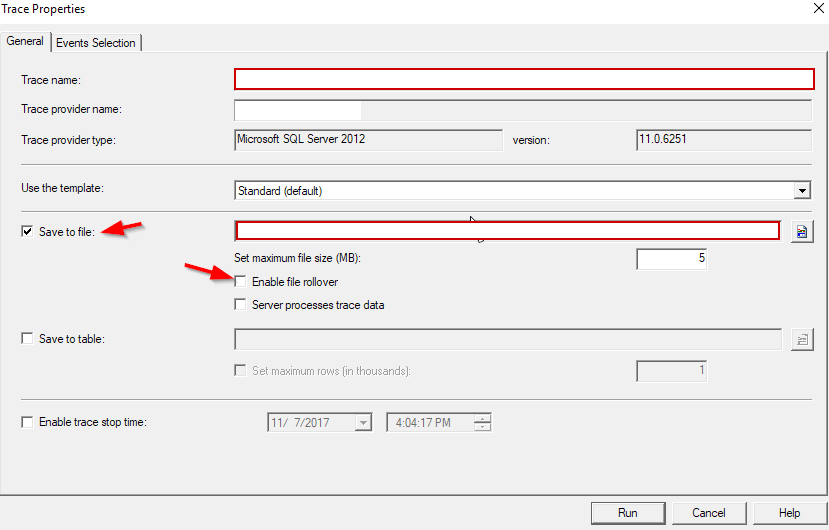
- On the next screen give the trace a name and in the "Use the template:" field click Standard.
- Click the check box next to Save to file, give it a path and name, and uncheck "Enable file rollover"(unless you expect a very large sync in which case use the rollover).

- Click the Events Selection tab.
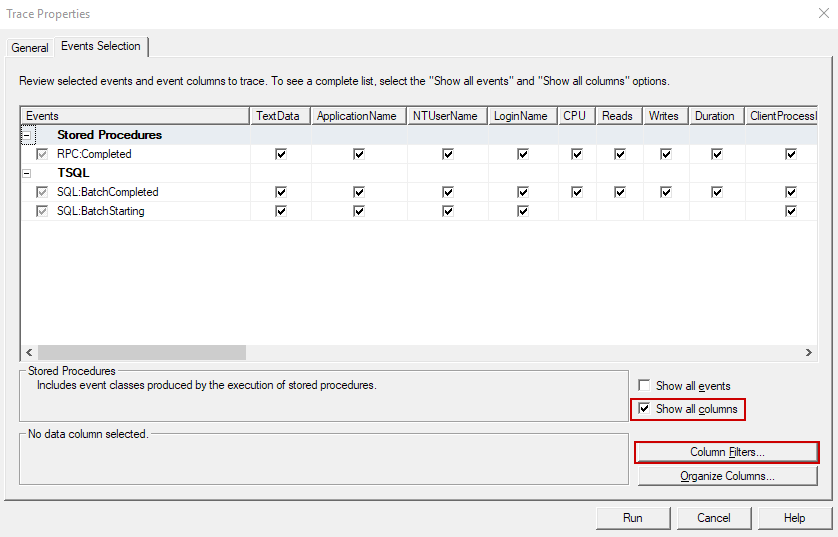
- Uncheck the Security audit events on the left side. This should make the audit login and audit logout rows unchecked.
- Check the textdata column for the stored procedure event.
- When it's done it should look like this.

- Click Show all columns.
- Click Column Filters...
- Click DatabaseName
- Click like and enter the database name of the database you are syncing to.
- Click on TextData.
- Click like and enter %sync_%.
- Click Run.
Please sign in to leave a comment.