For information about setting up analytics in CMP, see Install JavaScript Snippet.
The Analytics view lets you measure the performance of your content and how your content contributes to business objectives.
Interpret analytics metrics
Analytics captures your article views, page views, unique visitors, average attention time, and engagement rate to portray a high-level analysis of how your content is performing. See also: Analytics terms.
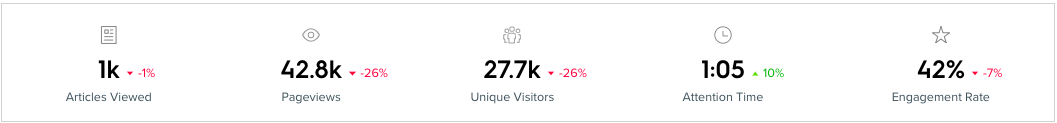
- Articles viewed – The number of articles read during the article view date and published date ranges.
- Pageviews – The total number of views the articles you produced have generated during the period you've set in the article view and published date range.
- Unique Visitors – The number of unique people who viewed the article during the filtered article view and published date range.
- Attention Time – The average time a user engaged with the page. To generate this metric, CMP tracks each time a reader interacts with their browser (moves the mouse, scrolls, and so on). For example, if someone engages with the article for 30 seconds, switches tabs for an hour, and then returns to the article for another 30 seconds, then 60 seconds is the average engagement time, the total time the user viewed only that article.
- Engagement Rate – The percentage of page views where users engaged with your content for over 30 seconds.
Filter analytic data
Many filters for the analytic data are on the left-hand side of the page, where you can find the analytics information you want to see.
You can choose which graph you want to see: page views, unique visitors, engagement rare, average attention time, and average pageviews per visitor. The chart below shows an example of the Pageviews filter.
Track content performance
To get a detailed view of each piece of content, scroll below the graph to sort by other metrics.
You can view articles by publish date, page views, unique visitors, average attention time, engagement rate, and average scroll depth. You also can view and sort articles by channels (social, direct, email, and so on), authors, target audience, or other custom labels.
You can also view detailed information about the specific article by clicking on it. This shows metrics, conversion performance, the top channels with which the article resonated, the average scroll depth, and more.
Export data
Click Export in the upper right-hand corner of the analytics view. A dialog box displays where you can select a date range for the report. Click Email Analytics to send the CSV report to your inbox.
The report looks similar to the following image.
Please sign in to leave a comment.